IRR (Internal Rate of Return) and CAGR (Compound Annual Growth Rate) are methods that can be used to calculate the value of an investment, but they are not the same.
IRR vs CAGR comes up a lot in different investing contexts, and it’s important to understand when and where to use each. Let’s look at each, separately, then compare them.
What is CAGR?
CAGR, the compound annual growth rate, is the be-all and end-all of how well an investment has done, from a starting date to an ending date. It tells you how much money has grown on an annual basis.
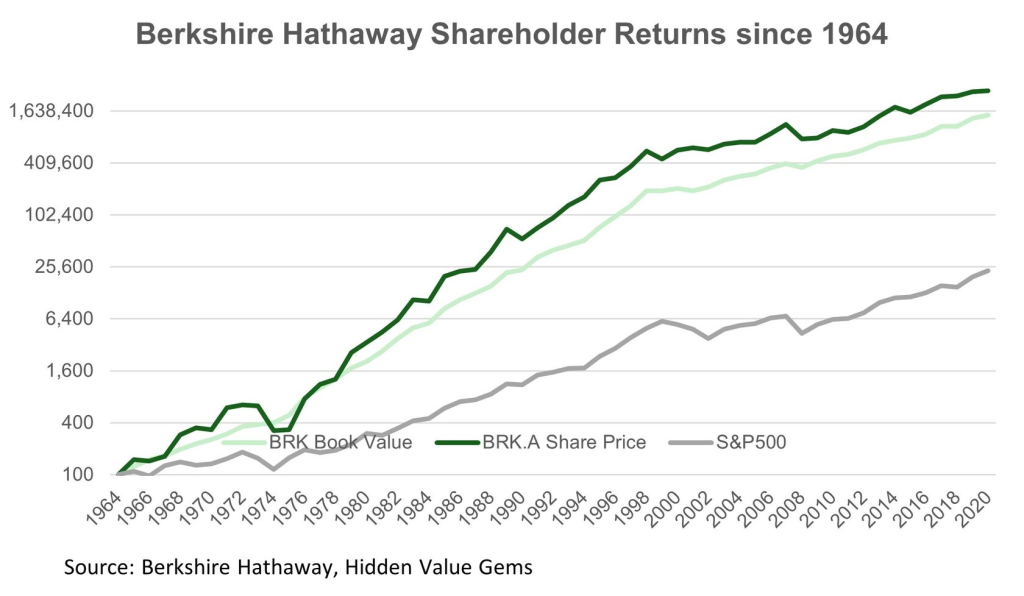
When people talk about Warren Buffett as the greatest investor of all time, they talk about his incredible CAGR of 20% over 60 years with his company Berkshire Hathaway. CAGR above market average (8%) becomes increasingly harder over longer periods. This is usually because luck often plays a factor, you go through boom and bust cycles where the stock market gets really high and really low. Over longer periods that all evens out.
The CAGR formula
[starting amount] * (1 + [rate of growth])^[periods of time]Let’s say we gave Warren Buffett a $100 at the start of his 70 years.
$100 * (1 + 20%)^70 =
$100 * 1.2^70 =
$100 * 1,800,190.39 =
$180,019,039
It’s pretty incredible to turn $100 into 180 million dollars.
What about the inverse, what if someone tells you they can turn your $100 into $500 in 3 years, what is the CAGR? Here’s the formula:
([ending amount] / [starting amount])^(1 / [periods of time]) - 1Let’s do the math:
($500 / $100)^(1 / 3) - 1
= 5^(1/3) - 1
= 1.70997595 - 1
~= 70.99%
This means if someone offered you a deal that turned your $100 into $500 in 3 years, you would have a CAGR of 70.99%, that’s a great amount!
If you’re like most people and don’t want to do the math, you can always use a CAGR Calculator. I like to show the formula so that you can see how it works and it doesn’t “feel like magic”, but for practical purposes having a calculator is nice.
What is IRR?
If CAGR is so great, why do we need IRR? The answer confused me (and apparently others, if you are reading this.)
IRR, or the internal rate of return, takes into account an important detail when evaluating one investment to another.
While CAGR is great for seeing historical values, IRR is better at determining future investments. This is because IRR incorporates something called the time value of money.
If you haven’t heard of this concept before, let me try to explain it. Let’s say there was a trip you wanted to go on and it cost you $3,000, the exact amount of your annual bonus. The problem is that you won’t get your bonus for another 9 months. Even though the $3,000 now versus 9 months from now is the same dollar amount, it would have greater value if you had it immediately.
Let’s look at another extreme example. Let’s say you won a lottery for millions of dollars, but you didn’t read the fine print. They said they would pay you in 50 years. Congratulations, you’re a future millionaire! Unfortunately, in 50 years, you might be in your 70s or 80s, and not have very much value for the money at that time.
A final and perhaps most realistic example, the way that most investors think about it, you could be earning money on your money if you had it now. Let’s say your average return on your investment is 10%. If you had $1,000 now, 1 year from now, it would be worth $1,100. If you were given $1,000 in a year from now instead, you lose out on that $100.
This concept of the time value of money is really important and used in many more advanced investing calculations. In this case, it’s used to calculate the IRR. In the CAGR examples, we just needed the starting amount and the ending amount. For IRR, we want to incorporate *when* we get the money.
The IRR formula is pretty complex, and the way most people do it is using Microsoft Excel or Google Sheet’s IRR function. It asks for the series of each periodic cash flow. For instance, let’s say you invested in your friend’s business and gave them $1,000, and they expected to give you back money as follows:
| Investing amount | Payments | |||
| -$1000 | $400 | $500 | $600 | $700 |
Imagine that each payment is every year, it isn’t until year 3 that you have all your money back. If we plug those 5 values into the Google Sheets IRR function, it tells us the IRR is 36%.
Here’s where it gets complex.
What does that 36% mean? It’s supposed to tell you the expected growth rate of the investment, which sounds a lot like CAGR. But it’s not that, in fact, we can calculate the CAGR on this same deal to be 21%.
It’s incorporating how valuable it is based on when you get the money, not just how much you get. Let me illustrate, let me give you a different set of numbers for the investment:
| Investing amount | Payments | |||
| -$1000 | $700 | $600 | $500 | $400 |
If you add up all the numbers, they are the same. The CAGR calculation for this is the exact same at 21%. However, now the IRR is 46%.
In the second example, it’s valuing the fact that you get the money sooner, and can reinvest that money (the IRR function assumes into a similar investment). It’s important to note that if you cannot or don’t expect to reinvest the money, or receiving the money sooner is *not* more valuable for you, this isn’t a helpful tool.
This is useful when you’re looking at different investing options. If you’re looking at a real estate deal that pays you yearly income that you can reinvest compared to loaning your money where you get all your money at the end, it can help give you a number as to which one is better. This is the power of IRR and you will see it is often quoted when people are trying to pitch their investments.
IRR vs CAGR in summary
We now know what IRR and CAGR are, and how they are used. CAGR is usually used when comparing historical performance records (often with stock market portfolios or hedge funds), while IRR is usually used when comparing cash-flowing investment options (such as real estate or loans).
Neither one is better than the other, and they each have their value in the right context. I calculate both when both are applicable.